Prices have fallen to new contract lows this week. The failure to find a foothold above the 60.00 mark and the break below the previous low (registered on Feb 11th) led to sustained pressure. Based on the active daily continuation chart, prices are at the lowest level since January of 2015. The low then was 57.05, i.e. only a few points below yesterday’s low (basis May16 contract). To find cheaper levels one would need to go all the way back to 2009.
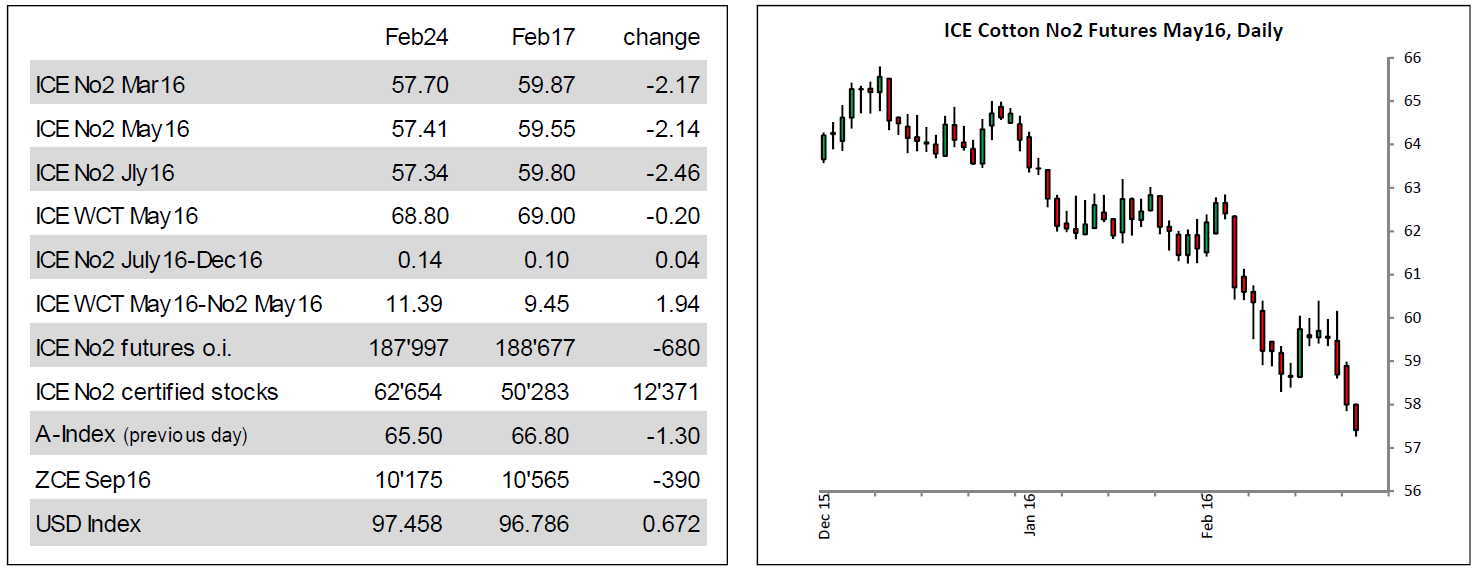
The volume that accompanied the decline was not outstanding and there is some momentum/price divergence in place. This may imply that the market is losing down-side force and that a period of corrective trading activity may begin soon.
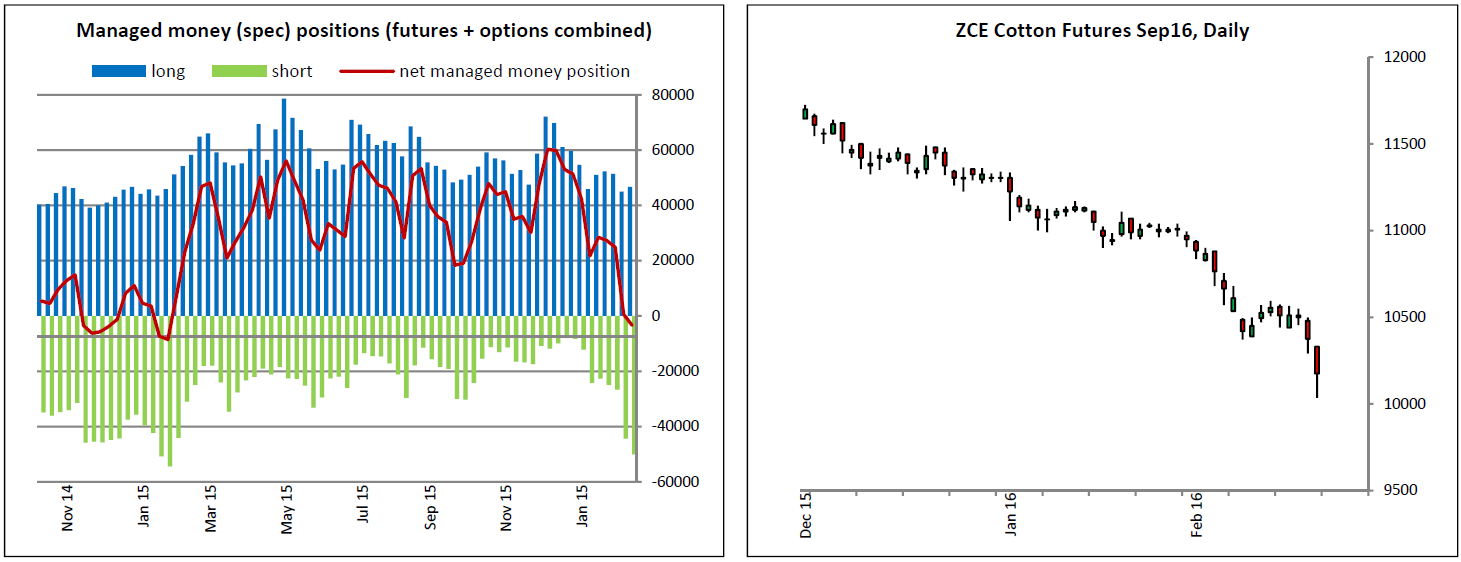
The latest CFTC Commitments of Traders Report (figures per Feb16th) showed managed money funds to be net short with about 3Ά000 lots and since then they likely have added more shorts. As outlined in last weekΆs report, the history of the past five years has shown that managed money funds do not sit on net shorts over a long period of time. Obviously, it remains to be seen whether history will repeat itself.
Technical picture: Prices have reached the minimum down-side target basis the break below 58.30 (i.e. 57.50-57.00). Next potential target area is 56.50-55.50. Short-term resistance is at 58.50, 59.20 and key a 60.00-60.50.
USA – When the USDA released its February monthly production and supply/demand estimates, the numbers were not pretty, however that report isnΆt the only thing affecting cotton right now. Recently the Turkish government completed a 1 A year AntiADumping investigation which, if officially imposed, will put duties on U.S. cotton from 3-8 percent. This investigation was likely politically motivated, but none the less, its implementation is imminent. Physiologically, the outcome of this finding has to be influencing the direction of U.S. cotton prices for both old and new crop. The negative effect on new crop prices is surfacing as it is already being suggested that actual cotton planted will be less than the National Cotton CouncilΆs 9.1 million acres figure from earlier this month. Now we await USDAΆs first estimate set to be released on March 31. Fortunately, because prices have taken a tumble does not mean acres will necessarily decline. Growers know that Loan Deficiency Payments are available when prices are low, and cotton seed rebates can equal 10 cents per pound or more. This means the futures market isnΆt the only planting indicator. As planting time approaches, grain price comparisons, expected LDPs, and other sources of income will come into play. Given the recent slide in cotton prices, cotton, corn and soybean prices appear to be in a similar relationship. In any event, acres harvested and yields are more important price drivers than acres planted. So, regardless of how plantings work out, Mother Nature will ultimately be a key factor in determining 2016 prices.
India – Indian cotton prices traded lower tracking bearish cues from overseas market. As per the latest report of Cotton Corporation of India (CCI), new crop arrivals have reached to 21m bales (each bale 170 Kgs) in the current 2015-16 season till 23rd February. Sources revealed that India exported around 4.9mbales (each bale 170 Kgs) of cotton during 1stOctober 2015 to 15th February 2016, main buyers were Pakistan and Bangladesh both in total accounting more than 65 % of the total export volumes during this period. During the week, import businesses were reported for West African S-Types 1.1/8 at around USC 65.50 per lb CFR for April shipment mainly booked by mills in Southern India.
Australia – Cotton picking started in Central Queensland and first shipments will be possible in March/April.
The 2016 crop is currently pegged at 2.4m Australian bales and no major changes are expected anymore to either side. Approximately 70 % of the 2016 crop is reported to be sold at origin but sales came close to a standstill with the AUD moving back to 71-72 cents vs. the USD and NYF dropping to new long-term lows.
Lower NYF levels have for long been offset by the AUD falling in line with the general commodity complex over the past two years, offsetting the NYF drop by and large and keeping AUD cash prices at origin relatively high.
Accompanied by lack of Chinese demand who traditionally accounts for the majority of the Australian cotton consumption and a general rationing of world high grade cotton demand, this was one of the factors that the Australian basis came under tremendous pressure during 2015.
However, current price levels offered in the export markets have stabilized and prices appear today rather undervalued vs. competing crops.
China – After a short period of a narrow-ranged sideways consolidation around 10Ά500 (basis Sep16 contract) the market has finally broke to the downside reaching the next price objective at the all time low at 10Ά000 (basis most active continuation chart) going back to November 2008. It is difficult to find the next downside target below 10Ά000, prices should find some support, at least temporary, at around 9650-9480. However, after the recent sharp drop a period of a consolidation or even a correction with the initial pull back target 10Ά400 become likely.
Domestic markets are slowly coming back after the Spring Festival holidays; some mills are expected to remain closed until late February due to generally bad business conditions. Prices for physical cotton in the spot market have come down but remain at a huge premium over ZCE futures; prompt available XJ 328 is quoted around 12Ά000 RMB/ton ex warehouse, almost 1300 RMB/ton or 9 c/lb over ZCE May. So itΆs no surprise that certified stocks arenΆt growing, and the inverse in ZCE continues strong even after a recent correction. As usual there is no official announcement regarding Reserve selling policy. It is generally expected that Reserve offers will start sometime in April, at a price based on an average of domestic and international prices. That would mean initially rather high offering prices, weakening with time, as domestic indices will come under pressure as reserve sales progress.